
 A SCHOLARLY BOOK REPOSITORY
Advanced Econometrics is both a comprehensive text for graduate students and a reference work for econometricians. It will also be valuable to those doing statistical analysis in the other social sciences. Its main features are a thorough treatment of cross-section models, including qualitative response models, censored and truncated regression models, and Markov and duration models, as well as a rigorous presentation of large sample theory, classical least-squares and generalized least-squares theory, and nonlinear simultaneous equation models.
Although the treatment is mathematically rigorous, the author has employed the theorem-proof method with simple, intuitively accessible assumptions. This enables readers to understand the basic structure of each theorem and to generalize it for themselves depending on their needs and abilities. Many simple applications of theorems are given either in the form of examples in the text or as exercises at the end of each chapter in order to demonstrate their essential points.
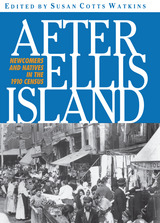
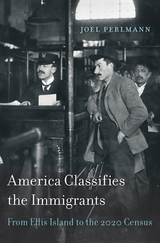
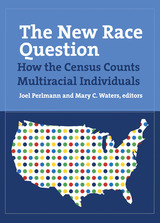
When more than twenty million immigrants arrived in the United States between 1880 and 1920, the government attempted to classify them according to prevailing ideas about race and nationality. But this proved hard to do. Ideas about racial or national difference were slippery, contested, and yet consequential—were “Hebrews” a “race,” a “religion,” or a “people”? As Joel Perlmann shows, a self-appointed pair of officials created the government’s 1897 List of Races and Peoples, which shaped exclusionary immigration laws, the wording of the U.S. Census, and federal studies that informed social policy. Its categories served to maintain old divisions and establish new ones.
Across the five decades ending in the 1920s, American immigration policy built increasingly upon the belief that some groups of immigrants were desirable, others not. Perlmann traces how the debates over this policy institutionalized race distinctions—between whites and nonwhites, but also among whites—in immigration laws that lasted four decades.
Despite a gradual shift among social scientists from “race” to “ethnic group” after the 1920s, the diffusion of this key concept among government officials and the public remained limited until the end of the 1960s. Taking up dramatic changes to racial and ethnic classification since then, America Classifies the Immigrants concentrates on three crucial reforms to the American Census: the introduction of Hispanic origin and ancestry (1980), the recognition of mixed racial origins (2000), and a rethinking of the connections between race and ethnic group (proposed for 2020).
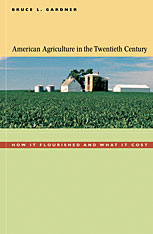
American agriculture in the twentieth century has given the world one of its great success stories, a paradigm of productivity and plenty. Yet the story has its dark side, from the plight of the Okies in the 1930s to the farm crisis of the 1980s to today's concerns about low crop prices and the impact of biotechnology. Looking at U.S. farming over the past century, Bruce Gardner searches out explanations for both the remarkable progress and the persistent social problems that have marked the history of American agriculture.
Gardner documents both the economic difficulties that have confronted farmers and the technological and economic transformations that have lifted them from relative poverty to economic parity with the nonfarm population. He provides a detailed analysis of the causes of these trends, with emphasis on the role of government action. He reviews how commodity support programs, driven by interest-group politics, have spent hundreds of billions of dollars to little purpose. Nonetheless, Gardner concludes that by reconciling competing economic interests while fostering productivity growth and economic integration of the farm and nonfarm economies, the overall twentieth-century role of government in American agriculture is fairly viewed as a triumph of democracy.
To show how the statistics can both disguise and highlight problems, Schneider alternates a discussion of the numbers with vivid encounters with individual children and adults: the middle-class black high school student's offhand explanation about how to get a gun; a vital statistics bureau worker's astonishment at his own classification as Hispanic; a young woman's pleasure in holding down a job after teachers dismissed her as learning disabled; and a latchkey child's nightmare of coming home from school to an empty house when she was sick.
This book guides us through the morass of numbers bandied about to describe the state of America's children—what the numbers tell us and what they don't—and it offers a call for action. Comprehensive in its treatment of all groups of children and accessible in style, this book is essential for anyone concerned about children in American society.

Based on 260 surveys and 47 in-depth interviews, this study combines quantitative and qualitative research to explore the level and characteristics of immigrant incorporation in Beardstown and Monmouth. It assesses the advancement of immigrants in the immigration/ residency/citizenship process, the immigrants’ level of cultural integration (via language, their connectedness with other members of society, and their relationships with neighbors), the degree and characteristics of discrimination against immigrants in these two towns, and the extent to which immigrants participate in different social and political activities and trust government institutions.
Immigrants in new destinations are likely to be poorer, to be less educated, and to have weaker English-language skills than immigrants in traditional destinations. Studying how this population negotiates the obstacles to and opportunities for incorporation is crucial.
When it comes to sizing up America’s public schools, test scores are the go-to metric of state policy makers and anxious parents looking to place their children in the “best” schools. Yet ample research indicates that standardized tests are a poor way to measure a school’s performance. It is time—indeed past time—to rethink this system, Jack Schneider says.
Beyond Test Scores reframes current debates over school quality by offering new approaches to educational data that can push us past our unproductive fixation on test scores. Using the highly diverse urban school district of Somerville, Massachusetts, as a case study, Schneider and his research team developed a new framework to more fairly and comprehensively assess educational effectiveness. And by adopting a wide range of measures aligned with that framework, they were able to more accurately capture a broader array of school strengths and weaknesses. Their new data not only provided parents, educators, and administrators with a clearer picture of school performance, but also challenged misconceptions about what makes a good school.
With better data, Schneider shows, stakeholders at the federal, state, and local levels can undo the damage of present accountability systems and build greater capacity in our schools. Policy makers, administrators, and school leaders can better identify where assistance is needed. Educators can engage in more evidence-based decision making. And parents can make better-informed choices for their children. Perhaps most importantly, better data can facilitate communication among all these groups, allowing them to take collective action toward shared, concrete goals.
The existing infrastructure for the production of key economic statistics relies heavily on data collected through sample surveys and periodic censuses, together with administrative records generated in connection with tax administration. The increasing difficulty of obtaining survey and census responses threatens the viability of existing data collection approaches. The growing availability of new sources of Big Data—such as scanner data on purchases, credit card transaction records, payroll information, and prices of various goods scraped from the websites of online sellers—has changed the data landscape. These new sources of data hold the promise of allowing the statistical agencies to produce more accurate, more disaggregated, and more timely economic data to meet the needs of policymakers and other data users. This volume documents progress made toward that goal and the challenges to be overcome to realize the full potential of Big Data in the production of economic statistics. It describes the deployment of Big Data to solve both existing and novel challenges in economic measurement, and it will be of interest to statistical agency staff, academic researchers, and serious users of economic statistics.

The result is a compendium of data and analysis that can be found nowhere else and which will be an invaluable sourcebook for students of Canadian political behavior.
When we think about history, we often think about people, events, ideas, and revolutions, but what about the numbers? What do the data tell us about what was, what is, and how things changed over time? Economist Robert E. Gallman (1926–98) gathered extensive data on US capital stock and created a legacy that has, until now, been difficult for researchers to access and appraise in its entirety.
Gallman measured American capital stock from a range of perspectives, viewing it as the accumulation of income saved and invested, and as an input into the production process. He used the level and change in the capital stock as proxy measures for long-run economic performance. Analyzing data in this way from the end of the US colonial period to the turn of the twentieth century, Gallman placed our knowledge of the long nineteenth century—the period during which the United States began to experience per capita income growth and became a global economic leader—on a strong empirical foundation. Gallman’s research was painstaking and his analysis meticulous, but he did not publish the material backing to his findings in his lifetime. Here Paul W. Rhode completes this project, giving permanence to a great economist’s insights and craftsmanship. Gallman’s data speak to the role of capital in the economy, which lies at the heart of many of the most pressing issues today.
Contemporaries of Carroll D. Wright (1840-1909) lived through the transformation of American society by the industrial revolution. For the most part they thought the transformation represented growth and progress, but many also found occasion for doubt and fear in its consequences. Their anxieties collected around the notions of a "labor problem" and "labor reform." Whether from hope or fear, people felt a need for statistical information. On this popular demand Wright built his career as statistical expert and renowned master of "labor statistics." His investigations during thirty-two years of government service (1873-1905) gave form to contemporary ideas and set precedents for modern procedures, as in his seminal studies of wages, prices, and strikes.
In telling how Wright took up this unprecedented career, Mr. Leiby shows the importance of Wright's early years and relates his work to the politics and religion of his time as well as to its social science. In this perspective, the history of the labor bureaus and their voluminous reports take on their original human purposes and meaning.
A landmark finding in this study is that different combinations of cultural factors contribute to the physical and sexual abuse of black and white children in rural, small-town, and urban communities. The rates of abuse discovered and reported in small towns are revealed to be materially higher than those in rural or urbanized locations, especially for young white males, and the authors query whether this indicates higher rates of abuse or higher rates of reporting
Child Abuse in the Deep South provides a quantitative benchmark that investigators and policy-makers will find invaluable on the path to defining at-risk populations, effective interventions, and treatments.
Using ethnographic and demographic data from a three-year study in rural Gambia, Contingent Lives explains this seemingly counterintuitive fact by juxtaposing two very different understandings of the life course: one is a linear, Western model that equates aging and the ability to reproduce with the passage of time, the other a Gambian model that views aging as contingent on the cumulative physical, social, and spiritual hardships of personal history, especially obstetric trauma. Viewing each of these two models from the perspective of the other, Caroline Bledsoe produces fresh understandings of the classical anthropological subjects of reproduction, time, and aging as culturally shaped within women's conjugal lives. Her insights will be welcomed by scholars of anthropology and demography as well as by those working in public health, development studies, gerontology, and the history of medicine.
“McCloskey and Ziliak have been pushing this very elementary, very correct, very important argument through several articles over several years and for reasons I cannot fathom it is still resisted. If it takes a book to get it across, I hope this book will do it. It ought to.”
—Thomas Schelling, Distinguished University Professor, School of Public Policy, University of Maryland, and 2005 Nobel Prize Laureate in Economics
“With humor, insight, piercing logic and a nod to history, Ziliak and McCloskey show how economists—and other scientists—suffer from a mass delusion about statistical analysis. The quest for statistical significance that pervades science today is a deeply flawed substitute for thoughtful analysis. . . . Yet few participants in the scientific bureaucracy have been willing to admit what Ziliak and McCloskey make clear: the emperor has no clothes.”
—Kenneth Rothman, Professor of Epidemiology, Boston University School of Health
The Cult of Statistical Significance shows, field by field, how “statistical significance,” a technique that dominates many sciences, has been a huge mistake. The authors find that researchers in a broad spectrum of fields, from agronomy to zoology, employ “testing” that doesn’t test and “estimating” that doesn’t estimate. The facts will startle the outside reader: how could a group of brilliant scientists wander so far from scientific magnitudes? This study will encourage scientists who want to know how to get the statistical sciences back on track and fulfill their quantitative promise. The book shows for the first time how wide the disaster is, and how bad for science, and it traces the problem to its historical, sociological, and philosophical roots.
Stephen T. Ziliak is the author or editor of many articles and two books. He currently lives in Chicago, where he is Professor of Economics at Roosevelt University. Deirdre N. McCloskey, Distinguished Professor of Economics, History, English, and Communication at the University of Illinois at Chicago, is the author of twenty books and three hundred scholarly articles. She has held Guggenheim and National Humanities Fellowships. She is best known for How to Be Human* Though an Economist (University of Michigan Press, 2000) and her most recent book, The Bourgeois Virtues: Ethics for an Age of Commerce (2006).

Clifford Trafzer's disturbing new work, Death Stalks the Yakama, examines life, death, and the shockingly high mortality rates that have persisted among the fourteen tribes and bands living on the Yakama Reservation in the state of Washington. The work contains a valuable discussion of Indian beliefs about spirits, traditional causes of death, mourning ceremonies, and memorials. More significant, however, is Trafzer's research into heretofore unused parturition and death records from 1888-1964. In these documents, he discovers critical evidence to demonstrate how and why many reservation people died in "epidemics" of pneumonia, tuberculosis, and heart disease.
Death Stalks the Yakama, takes into account many variables, including age, gender, listed causes of death, residence, and blood quantum. In addition, analyses of fetal and infant mortality rates as well as crude death rates arising from tuberculosis, pneumonia, heart disease, accidents, and other causes are presented. Trafzer argues that Native Americans living on the Yakama Reservation were, in fact, in jeopardy as a result of the "reservation system" itself. Not only did this alien and artificial culture radically alter traditional ways of life, but sanitation methods, housing, hospitals, public education, medicine, and medical personnel affiliated with the reservation system all proved inadequate, and each in its own way contributed significantly to high Yakama death rates.
Drawing on the authors' experience as economists and educators, this book offers an accessible analysis of three crucial economic issues: the growth and composition of undergraduate enrollments, the supply of faculty in the academic labor market, and the cost of operating colleges and universities. The study provides valuable insights for administrators and scholars of education.
The nine papers in this volume exploit the substantial variation in U.S. tax policy during the last two decades to investigate how taxes affect a range of household behavior, including labor-force participation, saving behavior, choice of health insurance plan, choice of child care arrangements, portfolio choice, and tax evasion. They also present new analytical results on the effects of different types of tax policy. All of this research relies on household-level data—drawn either from public-use tax return files or from large household-level surveys—to explore various aspects of the relationship between taxes and household behavior.
As debates about the effects of proposed tax reforms continue in the 1990s, this volume will be of interest to policy makers and scholars in the field of public finance.

This volume contains papers presented at a conference in May 1988 in Washington, D.C., commemorating the fiftieth anniversary of the founding of the Conference on Research in Income and Wealth (CRIW). The call for papers emphasized assessments of broad topics in economic measurement, both conceptual and pragmatic. The organizers desired (and succeeded in obtaining) a mix of papers that, first, illustrate the range of measurement issues that economics as a science must confront and, second, mark major milestones of CRIW accomplishment. The papers concern prices and output (Griliches, Pieper, Triplett) and also the major productive inputs, capital (Hulten) and labor (Hamermesh). Measures of saving, the source of capital accumulation, are covered in one paper (Boskin); measuring productivity, the source of much of the growth in per capita income, is reviewed in another (Jorgenson). The use of economic data in economic policy analysis and in regulation are illustrated in a review of measures of tax burden (Atrostic and Nunns) and in an analysis of the data needed for environmental regulation (Russell and Smith); the adequacy of data for policy analysis is evaluated in a roundtable discussion (chapter 12) involving four distinguished policy analysts with extensive government experience in Washington and Ottawa.
In 2013, NBA point guard Steph Curry wowed crowds when he sunk 11 out of 13 three-pointers for a game total of 54 points—only seven other players, including Michael Jordan and Kobe Bryant, had scored more in a game at Madison Square Garden. Four years later, the University of Connecticut women’s basketball team won its hundredth straight game, defeating South Carolina 66–55. And in 2010, one forecaster—an octopus named Paul—correctly predicted the outcome of all of Germany’s matches in the FIFA World Cup. These are surprising events—but are they truly improbable?
In Get in the Game, mathematician and sports analytics expert Tim Chartier helps us answer that question—condensing complex mathematics down to coin tosses and dice throws to give readers both an introduction to statistics and a new way to enjoy sporting events. With these accessible tools, Chartier leads us through modeling experiments that develop our intuitive sense of the improbable. For example, to see how likely you are to beat Curry’s three-pointer feat, consider his 45.3 percent three-point shooting average in 2012–13. Take a coin and assume heads is making the shot (slightly better than Curry at a fifty percent chance). Can you imagine getting heads eleven out of thirteen times? With engaging exercises and fun, comic book–style illustrations by Ansley Earle, Chartier’s book encourages all readers—including those who have never encountered formal statistics or data simulations, or even heard of sports analytics, but who enjoy watching sports—to get in the game.
The Global Burden of Disease and Injury Series details and analyzes global patterns of death and disability, providing a bold, comprehensive examination of the state of the world's health.
The Global Burden of Disease (GBD) provides systematic epidemiological estimates for an unprecedented 150 major health conditions. Its methods and results are presented here, including: disaggregated death and disability data; projections to the year 2020; and risk factor evaluations. While it minutely examines causes of death, the GBD is unique in its inclusion of disability. The authors explore the technical bases and moral implications of incorporating social, physical, and mental disabilities in health assessments, explicating the indicator they have developed, the disability-adjusted life-year (DALY). The GBD provides indispensable global and regional data for health planning, research, and education.
Among the study's results: Depression was the fourth leading cause of disease-burden in 1990 and by 2020 will be the single leading cause. Injuries cause over 15 percent of death and disability. HIV will by 2010 inflict as great a burden as the age-old epidemic tuberculosis. By 2020, tobacco use will account for 9 million deaths annually. Ultimately, pneumonia and diarrhea, both primarily diseases of childhood, will continue to inflict the greatest health burden of all.

This book provides a systematic exposition of a group-based statistical method for analyzing longitudinal data in the social and behavioral sciences and in medicine. The methods can be applied to a wide range of data, such as that describing the progression of delinquency and criminality over the life course, changes in income over time, the course of a disease or physiological condition, or the evolution of the socioeconomic status of communities. Using real-world research data from longitudinal studies, the book explains and applies this method for identifying distinctive time-based progressions called developmental trajectories. Rather than assuming the existence of developmental trajectories of a specific form before statistical data analysis begins, the method allows the trajectories to emerge from the data itself. Thus, in an analysis of data on Montreal school children, it teases apart four distinct trajectories of physical aggression over the ages 6 to 15, examines predictors of these trajectories, and identifies events that may alter the trajectories.
Aimed at consumers of statistical methodology, including social scientists, criminologists, psychologists, and medical researchers, the book presents the statistical theory underlying the method with a mixture of intuition and technical development.
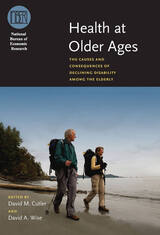
This breakthrough volume argues that educational attainment, high socioeconomic status, an older retirement age, and accessible medical care have improved the health and quality of life of seniors. Along the way, it outlines the economic benefits of disability decline, such as an increased rate of seniors in the workplace, relief for the healthcare system and care-giving families, and reduced medical expenses for the elderly themselves. Health at Older Ages will be an essential contribution to the debate about meeting the medical needs of an aging nation.
From the health risks of sexual activity to those of pregnancy, abortion, and childbirth, reproduction constitutes enormous risks to a woman’s health. Ill-health conditions related to sex and reproduction account for 25 percent of the global disease burden in adult women. In sub-Saharan Africa, they account for over 40 percent. The catastrophic effects of reproductive ill-health, however, are not limited to women; for infants and adult men, they inflict 25 percent and 1 percent respectively of the global burden.
This volume offers comprehensive data and detailed discussions of the epidemiologies of three sexually transmitted diseases, HIV, and five specific maternal conditions, as well as those of congenital anomalies and perinatal conditions. Projections of the HIV epidemic are provided: by 2020 HIV is projected to double to 2.5 percent of the global disease burden.
Health Dimensions of Sex and Reproduction will serve as a comprehensive reference for epidemiologists, public health specialists, practitioners and advocates of STD and HIV prevention, and reproductive and neonatal health.
The new gospel promulgated by Thorn and Palmer opened the door for a flood of new questions, such as how a ballpark’s layout helps or hinders offense or whether a strikeout really is worse than another kind of out. Taking questions like these seriously—and backing up the answers with data—launched a new era, showing fans, journalists, scouts, executives, and even players themselves a new, better way to look at the game.
This brand-new edition retains the body of the original, with its rich, accessible analysis rooted in a deep love of baseball, while adding a new introduction by the authors tracing the book’s influence over the years. A foreword by ESPN’s lead baseball analyst, Keith Law, details The Hidden Game’s central role in the transformation of baseball coverage and team management and shows how teams continue to reap the benefits of Thorn and Palmer’s insights today. Thirty years after its original publication, The Hidden Game is still bringing the high heat—a true classic of baseball literature.
Data analytics have revolutionized football. With play sheets informed by advanced statistical analysis, today’s coaches pass more, kick less, and go for more two-point or fourth-down conversions than ever before. In 1988, sportswriters Bob Carroll, Pete Palmer, and John Thorn proposed just this style of play in The Hidden Game of Football, but at the time baffled readers scoffed at such a heartless approach to the game. Football was the ultimate team sport and unlike baseball could not be reduced to pure probabilities. Nevertheless, the book developed a cult following among analysts who, inspired by its unorthodox methods, went on to develop the core metrics of football analytics used today: win probability, expected points, QBR, and more. With a new preface by Thorn and Palmer and a new foreword by Football Outsiders’s Aaron Schatz, The Hidden Game of Football remains an essential resource for armchair coaches, fantasy managers, and fans of all stripes.

This magnificent book is the first comprehensive history of statistics from its beginnings around 1700 to its emergence as a distinct and mature discipline around 1900. Stephen M. Stigler shows how statistics arose from the interplay of mathematical concepts and the needs of several applied sciences including astronomy, geodesy, experimental psychology, genetics, and sociology. He addresses many intriguing questions: How did scientists learn to combine measurements made under different conditions? And how were they led to use probability theory to measure the accuracy of the result? Why were statistical methods used successfully in astronomy long before they began to play a significant role in the social sciences? How could the introduction of least squares predate the discovery of regression by more than eighty years? On what grounds can the major works of men such as Bernoulli, De Moivre, Bayes, Quetelet, and Lexis be considered partial failures, while those of Laplace, Galton, Edgeworth, Pearson, and Yule are counted as successes? How did Galton’s probability machine (the quincunx) provide him with the key to the major advance of the last half of the nineteenth century?
Stigler’s emphasis is upon how, when, and where the methods of probability theory were developed for measuring uncertainty in experimental and observational science, for reducing uncertainty, and as a conceptual framework for quantitative studies in the social sciences. He describes with care the scientific context in which the different methods evolved and identifies the problems (conceptual or mathematical) that retarded the growth of mathematical statistics and the conceptual developments that permitted major breakthroughs.
Statisticians, historians of science, and social and behavioral scientists will gain from this book a deeper understanding of the use of statistical methods and a better grasp of the promise and limitations of such techniques. The product of ten years of research, The History of Statistics will appeal to all who are interested in the humanistic study of science.
Mary Poovey explores these questions in A History of the Modern Fact, ranging across an astonishing array of texts and ideas from the publication of the first British manual on double-entry bookkeeping in 1588 to the institutionalization of statistics in the 1830s. She shows how the production of systematic knowledge from descriptions of observed particulars influenced government, how numerical representation became the privileged vehicle for generating useful facts, and how belief—whether figured as credit, credibility, or credulity—remained essential to the production of knowledge.
Illuminating the epistemological conditions that have made modern social and economic knowledge possible, A History of the Modern Fact provides important contributions to the history of political thought, economics, science, and philosophy, as well as to literary and cultural criticism.
In Honest Numbers and Democracy, Walter Williams offers a revealing history of policy analysis in the federal government and a scorching critique of what’s wrong with social policy analysis today. Williams, a policy insider who witnessed the birth of domestic policy analysis during the Johnson administration, contends that the increasingly partisan U.S. political environment is vitiating both "honest numbers" — the data used to direct public policy — and, more importantly, honest analysts, particularly in the White House.
Drawing heavily on candid off-the-record interviews with political executives, career civil servants, elected officials and Washington-based journalists, Williams documents the steady deformation of social policy analysis under the pressure of ideological politics waged by both the executive and legislative branches. Beginning with the Reagan era and continuing into Clinton’s tenure, Williams focuses on the presidents’ growing penchant to misuse and hide numbers provided by their own analysts to assist in major policy decisions.
Honest Numbers and Democracy is the first book to examine in-depth the impact of the electronic revolution, its information overload, and rampant public distrust of the federal government's data on the practice of policy analysis.
A hard-hitting account of the factors threatening the credibility of the policymaking process, this book will be required reading for policy professionals, presidential watchers, and anyone interested in the future of U.S. democracy.
This book provides a language and a set of tools for finding bounds on the predictions that social and behavioral scientists can logically make from nonexperimental and experimental data. The economist Charles Manski draws on examples from criminology, demography, epidemiology, social psychology, and sociology as well as economics to illustrate this language and to demonstrate the broad usefulness of the tools.
There are many traditional ways to present identification problems in econometrics, sociology, and psychometrics. Some of these are primarily statistical in nature, using concepts such as flat likelihood functions and nondistinct parameter estimates. Manski's strategy is to divorce identification from purely statistical concepts and to present the logic of identification analysis in ways that are accessible to a wide audience in the social and behavioral sciences. In each case, problems are motivated by real examples with real policy importance, the mathematics is kept to a minimum, and the deductions on identifiability are derived giving fresh insights.
Manski begins with the conceptual problem of extrapolating predictions from one population to some new population or to the future. He then analyzes in depth the fundamental selection problem that arises whenever a scientist tries to predict the effects of treatments on outcomes. He carefully specifies assumptions and develops his nonparametric methods of bounding predictions. Manski shows how these tools should be used to investigate common problems such as predicting the effect of family structure on children's outcomes and the effect of policing on crime rates.
Successive chapters deal with topics ranging from the use of experiments to evaluate social programs, to the use of case-control sampling by epidemiologists studying the association of risk factors and disease, to the use of intentions data by demographers seeking to predict future fertility. The book closes by examining two central identification problems in the analysis of social interactions: the classical simultaneity problem of econometrics and the reflection problem faced in analyses of neighborhood and contextual effects.
This outstanding text by a foremost econometrician combines instruction in probability and statistics with econometrics in a rigorous but relatively nontechnical manner. Unlike many statistics texts, it discusses regression analysis in depth. And unlike many econometrics texts, it offers a thorough treatment of statistics. Although its only mathematical requirement is multivariate calculus, it challenges the student to think deeply about basic concepts.
The coverage of probability and statistics includes best prediction and best linear prediction, the joint distribution of a continuous and discrete random variable, large sample theory, and the properties of the maximum likelihood estimator. Exercises at the end of each chapter reinforce the many illustrative examples and diagrams. Believing that students should acquire the habit of questioning conventional statistical techniques, Takeshi Amemiya discusses the problem of choosing estimators and compares various criteria for ranking them. He also evaluates classical hypothesis testing critically, giving the realistic case of testing a composite null against a composite alternative. He frequently adopts a Bayesian approach because it provides a useful pedagogical framework for discussing many fundamental issues in statistical inference.
Turning to regression, Amemiya presents the classical bivariate model in the conventional summation notation. He follows with a brief introduction to matrix analysis and multiple regression in matrix notation. Finally, he describes various generalizations of the classical regression model and certain other statistical models extensively used in econometrics and other applications in social science.
Widely praised as the best available study of its kind, Marriage and Divorce, in a new, revised edition, incorporates recent statistics to bring its treatment up to date. This book is replete with information about factors affecting the stability of marriage, the decision to marry or to divorce, and differences in marriage and divorce patterns among various socioeconomic classes and races. There are, in addition, chapters on people who never marry, on the relationship of marital status and health, on family composition and living arrangements, and on work experience and income of married persons. The new, concluding chapter focuses on developments in the turbulent decade of the sixties and early seventies.
Sociologists, psychologists, marriage counselors, and practitioners in the medical and health fields as well as demographers will find this study invaluable, as will students in these and related areas.
How do you judge the quality of a school, a district, a teacher, a student? By the test scores, of course. Yet for all the talk, what educational tests can and can’t tell you, and how scores can be misunderstood and misused, remains a mystery to most. The complexities of testing are routinely ignored, either because they are unrecognized, or because they may be—well, complicated.
Inspired by a popular Harvard course for students without an extensive mathematics background, Measuring Up demystifies educational testing—from MCAS to SAT to WAIS, with all the alphabet soup in between. Bringing statistical terms down to earth, Daniel Koretz takes readers through the most fundamental issues that arise in educational testing and shows how they apply to some of the most controversial issues in education today, from high-stakes testing to special education. He walks readers through everyday examples to show what tests do well, what their limits are, how easily tests and scores can be oversold or misunderstood, and how they can be used sensibly to help discover how much kids have learned.
An edited volume that examines the data and statistics that are key to the music industry.
The music industries are fueled by statistics: sales targets, breakeven points, success ratios, royalty splits, website hits, ticket revenues, listener figures, piracy abuses, and big data. Statistics are of consequence. They influence the music that consumers get to hear, they determine the revenues of music makers, and they shape the policies of governments and legislators. Yet many of these statistics are generated by the music industries themselves, and their accuracy can be questioned. Music by Numbers sets out to explore this shadowy terrain.
This edited collection provides the first in-depth examination of the use and abuse of statistics in the music industry. Written by noted music business scholars and practitioners in the field, the book addresses five key areas in which numbers are employed: sales and awards; music industry policy; live music; music piracy; and digital solutions. The authors address these subjects from a range of perspectives: some of them test the veracity of this data and explore its tactical use by music businesses; others help to generate these numbers by developing surveys and online projects and offering candid observations.
The aim of this collection is to expose the culture and politics of data. Music industry statistics are pervasive, but despite this ubiquity they are underexplored. This book offers a corrective by providing new ways by which to learn music by numbers.
In the past twenty years, the number of educational tests with high-stakes consequences—such as promotion to the next grade level or graduating from high school—has increased. At the same time, the difficulty of the tests has also increased. In Texas, a Latina state legislator introduced and lobbied for a bill that would take such factors as teacher recommendations, portfolios of student work, and grades into account for the students—usually students of color—who failed such tests. The bill was defeated.
Using several types of ethnographic study (personal interviews, observations of the Legislature in action, news broadcasts, public documents from the Legislature and Texas Education Agency), Amanda Walker Johnson observed the struggle for the bill’s passage. Through recounting this experience, Objectifying Measures explores the relationship between the cultural production of scientific knowledge (of statistics in particular) and the often intuitive resistance to objectification of those adversely affected by the power of policies underwritten as "scientific."

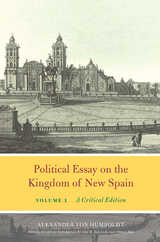
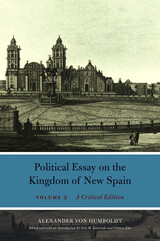
Alexander von Humboldt was the most celebrated modern chronicler of North and South America and the Caribbean, and this translation of his essay on New Spain—the first modern regional economic and political geography—covers his travels across today’s Mexico in 1803–1804. The work canvases natural-scientific and cultural-scientific objects alike, combining the results of fieldwork with archival research and expert testimony.
To show how people, plants, animals, goods, and ideas moved across the globe, Humboldt wrote in a variety of styles, bending and reshaping familiar writerly conventions to keep readers attentive to new inputs. Above all, he wanted his readers to be open-minded when confronted with cultural and other differences in the Americas. Fueled by his comparative global perspective on politics, economics, and science, he used his writing to support Latin American independence and condemn slavery and other forms of colonial exploitation. It is these voluminous and innovative writings on the New World that made Humboldt the undisputed father of modern geography, early American studies, transatlantic cultural history, and environmental studies.
This two-volume critical edition—the third installment in the Alexander von Humboldt in English series—is based on the full text, including all footnotes, tables, and maps, of the second, revised French edition of Essai politique sur le royaume de de Nouvelle Espagne from 1825 to 1827, which has never been translated into English before. Extensive annotations and full-color atlases are available on the series website.
Statistics-driven thinking is ubiquitous in modern society. In this ambitious and sophisticated study of the history of statistics, which begins with probability theory in the seventeenth century, Alain Desrosières shows how the evolution of modern statistics has been inextricably bound up with the knowledge and power of governments. He traces the complex reciprocity between modern governments and the mathematical artifacts that both dictate the duties of the state and measure its successes.
No other work, in any language, covers such a broad spectrum--probability, mathematical statistics, psychology, economics, sociology, surveys, public health, medical statistics--in accurately synthesizing the history of statistics, with an emphasis on the conceptual development of social statistics, culminating in twentieth-century applied econometrics.

With The Presence of Myth, Kolakowski demonstrates that no matter how hard man strives for purely rational thought, there has always been-and always will be-a reservoir of mythical images that lend "being" and "consciousness" a specifically human meaning.
"Kolakowski undertakes a philosophy of culture which extends to all realms of human intercourse—intellectual, artistic, scientific, and emotional. . . . [His] book has real significance for today, and may well become a classic in the philosophy of culture."—Anglican Theological Review
"Hanes Walton, Donald Deskins, and Sherman Puckett have produced a highly impressive collection and valuable contribution to the literature on American electoral politics. This work is indispensable for academic libraries, political scientists, historians, and serious students of American government."
---Immanuel Ness, Professor, Department of Political Science, Brooklyn College, City University of New York
"Massive amounts of information about presidential elections which are not readily available elsewhere. Unprecedented coverage in one volume of every single American presidential election."
---James Gimpel, Professor of Government, University of Maryland
"This is an extraordinary research endeavor; the most comprehensive set of aggregate election data ever assembled. Painstakingly researched, this color-coded volume presents data for every presidential election from 1789 to 2008. Unlike most, the wide ranging narrative for this atlas identifies racial patterns in the vote. Everyone who studies or is interested in presidential elections should have this impressive collection of statistical data in their libraries. A visual gem for the digital age."
---Robert Smith, Professor of Political Science, San Francisco State University
"Presidential Elections, 1789–2008 is a genuine tour de force that captures in an extremely accessible and comprehensive way the electoral geography of America's presidential elections, from Washington to Obama. An invaluable addition to the library of all those interested in presidential elections and U.S. politics."
---Marion Orr, Frederick Lippitt Professor of Public Policy and Professor of Political Science, Brown University
"This volume sets an extraordinarily high standard in scholarship, completeness, description, and explanation of our political process. It has been said that all politics are local, but never before has this been demonstrated with such clarity and panache, using the simple method of standardized tables summarizing voting, then showing state and county breakdowns of the numbers, greatly strengthened by beautiful full-color maps and cartograms. Every scholar of politics and democracy will benefit from the work laid out in this volume."
---Keith Clarke, Professor of Geography, University of California, Santa Barbara
Presidential Elections is an almanac of the popular vote in every presidential election in American history, analyzed at the county level with histories of each campaign, graphs, and stunning four-color maps. Most Americans are familiar with the crude red state/blue state maps used by commentators and campaign strategists---and even, for want of an alternative, by many academics. In providing a higher-resolution view of voting behavior the authors of this new volume enable examination of local and regional political trends that are invisible in state-level aggregations.
Presidential Elections will enable scholars to more subtly analyze voting behavior, campaigns, and presidential politics; commentators will use it to analyze trends and trace the historical evolution of new coalitions and voting blocs; strategists will use it to plan campaigns and mobilize constituencies. Presidential Elections will become the standard almanac on the subject: a required resource for academic and public libraries, as well as for scholars, consultants, and pundits nationwide.
Donald R. Deskins, Jr., is a political geographer and Emeritus Professor of Sociology and a former Associate Dean of the Horace H. Rackham School of Graduate Studies at the University of Michigan.
Hanes Walton, Jr., is Professor of Political Science at the University of Michigan. He also holds positions as Senior Research Scientist at the Center for Political Studies and as a faculty member in the Center for Afroamerican and African Studies.
Sherman C. Puckett is a Ph.D. graduate of the University of Michigan in urban and regional planning. He was a mayoral appointee in the data processing department of the Coleman A. Young administration in the City of Detroit and recently retired from Wayne County government as manager of technology, geographic information systems, and development of maintenance management systems.
How did Americans come to quantify their society’s progress and well-being in units of money? In today’s GDP-run world, prices are the standard measure of not only our goods and commodities but our environment, our communities, our nation, even our self-worth. The Pricing of Progress traces the long history of how and why we moderns adopted the monetizing values and valuations of capitalism as an indicator of human prosperity while losing sight of earlier social and moral metrics that did not put a price on everyday life.
Eli Cook roots the rise of economic indicators in the emergence of modern capitalism and the contested history of English enclosure, Caribbean slavery, American industrialization, economic thought, and corporate power. He explores how the maximization of market production became the chief objective of American economic and social policy. We see how distinctly capitalist quantification techniques used to manage or invest in railroad corporations, textile factories, real estate holdings, or cotton plantations escaped the confines of the business world and seeped into every nook and cranny of society. As economic elites quantified the nation as a for-profit, capitalized investment, the progress of its inhabitants, free or enslaved, came to be valued according to their moneymaking abilities.
Today as in the nineteenth century, political struggles rage over who gets to determine the statistical yardsticks used to gauge the “health” of our economy and nation. The Pricing of Progress helps us grasp the limits and dangers of entrusting economic indicators to measure social welfare and moral goals.
Statistics are everywhere: in news reports, at the doctor’s office, and in every sort of forecast, from the stock market to the weather. Blogger, teacher, and computer scientist Allen B. Downey knows well that people have an innate ability both to understand statistics and to be fooled by them. As he makes clear in this accessible introduction to statistical thinking, the stakes are big. Simple misunderstandings have led to incorrect medical prognoses, underestimated the likelihood of large earthquakes, hindered social justice efforts, and resulted in dubious policy decisions. There are right and wrong ways to look at numbers, and Downey will help you see which are which.
Probably Overthinking It uses real data to delve into real examples with real consequences, drawing on cases from health campaigns, political movements, chess rankings, and more. He lays out common pitfalls—like the base rate fallacy, length-biased sampling, and Simpson’s paradox—and shines a light on what we learn when we interpret data correctly, and what goes wrong when we don’t. Using data visualizations instead of equations, he builds understanding from the basics to help you recognize errors, whether in your own thinking or in media reports. Even if you have never studied statistics—or if you have and forgot everything you learned—this book will offer new insight into the methods and measurements that help us understand the world.
Are our elections for sale? Americans have long asked this question in the face of skyrocketing campaign spending by candidates and parties. Then, in the 1990s, came a wave of wealthy individuals whose deep pockets seemed to be buying political offices across the country. Our worst suspicions were confirmed. Or were they? What effect do self-financers really have on electoral outcomes? Jennifer Steen's authoritative empirical study of self-financed candidates is a landmark in American politics. Steen thoroughly dispels the notion that self-funded candidates can buy legislative seats, proving that the vast majority of self-financers do not win their elections. Her book gives us a truer understanding of self-financers' actual influence on campaign competition and rhetoric.
Jennifer A. Steen is Assistant Professor of Political Science at Boston College and a former political consultant. She is one of the nation's leading authorities on self-financed candidates.
What gives statistics its unity as a science? Stephen Stigler sets forth the seven foundational ideas of statistics—a scientific discipline related to but distinct from mathematics and computer science.
Even the most basic idea—aggregation, exemplified by averaging—is counterintuitive. It allows one to gain information by discarding information, namely, the individuality of the observations. Stigler’s second pillar, information measurement, challenges the importance of “big data” by noting that observations are not all equally important: the amount of information in a data set is often proportional to only the square root of the number of observations, not the absolute number. The third idea is likelihood, the calibration of inferences with the use of probability. Intercomparison is the principle that statistical comparisons do not need to be made with respect to an external standard. The fifth pillar is regression, both a paradox (tall parents on average produce shorter children; tall children on average have shorter parents) and the basis of inference, including Bayesian inference and causal reasoning. The sixth concept captures the importance of experimental design—for example, by recognizing the gains to be had from a combinatorial approach with rigorous randomization. The seventh idea is the residual: the notion that a complicated phenomenon can be simplified by subtracting the effect of known causes, leaving a residual phenomenon that can be explained more easily.
The Seven Pillars of Statistical Wisdom presents an original, unified account of statistical science that will fascinate the interested layperson and engage the professional statistician.

The plights of these emigrant groups have been addressed by different historians in different ways; this book is the first to examine the tragedies in terms of biology. Grayson shows that who lived or died can largely be explained by age, sex, and family ties. His investigation reveals what happens when our cultural mechanisms for dealing with famine and extreme cold are reduced to only what our bodies can provide within structured social contexts. His results are surprising and not always intuitive as he investigates who survived in these life threatening situations.

This solutions manual is a valuable companion volume to the classic textbook Recursive Methods in Economic Dynamics by Nancy L. Stokey, Robert E. Lucas, Jr., and Edward C. Prescott. The exercises in the Stokey et al. book are integral to the text, and thus, a reader cannot fully appreciate the text without understanding the results developed in the exercises. This manual provides detailed answers to the central exercises in Recursive Methods.
The authors’ selection of exercises is designed to maximize the reader’s understanding of Recursive Methods. Solutions are presented to every question in the core chapters on recursive methods, as well as most questions from the chapters on mathematical background. Some questions from the chapters on applications of these techniques to economic models have been reserved so as to provide instructors with a crucial “test bank” of questions.
Efficient and lucid in approach, this manual will greatly enhance the value of Recursive Methods as a text for self-study.
The Solutions Manual to Elements of Econometrics, Second Edition provides chapter solutions to the exercises in the college textbook: Elements of Econometrics, Second Edition by Jan Kmenta.
In the past decade, there has been a trend towards the global “harmonization” of migration statistics, largely inspired by international bodies and organizations that require comparative data. This volume provides an accessible account of the history of migration measurement in Europe and analyzes the current conceptualizations of migration and data-gathering procedures across twelve European countries. Based on this analysis, the authors provide critical insight into the migrant stocks and flows in their own countries and comment on recent trends in migration scholarship, such as the feminization of migration or the diversification of migrant’s origins.
A long-overdue guide on how to use statistics to bring clarity, not confusion, to policy work.
Statistics are an essential tool for making, evaluating, and improving public policy. Statistics for Public Policy is a crash course in wielding these unruly tools to bring maximum clarity to policy work. Former White House economist Jeremy G. Weber offers an accessible voice of experience for the challenges of this work, focusing on seven core practices:
- Thinking big-picture about the role of data in decisions
- Critically engaging with data by focusing on its origins, purpose, and generalizability
- Understanding the strengths and limits of the simple statistics that dominate most policy discussions
- Developing reasons for considering a number to be practically small or large
- Distinguishing correlation from causation and minor causes from major causes
- Communicating statistics so that they are seen, understood, and believed
- Maintaining credibility by being right (or at least respectably wrong) in every setting
Martin argues that the task of social statistics isn't to estimate parameters, but to reject false theory. He illustrates common pitfalls that can keep researchers from doing just that using a combination of visualizations, re-analyses, and simulations. Thinking Through Statistics gives social science practitioners accessible insight into troves of wisdom that would normally have to be earned through arduous trial and error, and it does so with a lighthearted approach that ensures this field guide is anything but stodgy.
Herbert F. Weisberg's handbook presents a unified method for conducting good survey research centered on the various types of errors that can occur in surveys—from measurement and nonresponse error to coverage and sampling error. Each chapter is built on theoretical elements drawn from specific disciplines, such as social psychology and statistics, and follows through with detailed treatments of the specific types of error and their potential solutions. Throughout, Weisberg is attentive to survey constraints, including time and ethical considerations, as well as controversies within the field and the effects of new technology on the survey process—from Internet surveys to those completed by phone, by mail, and in person. Practitioners and students will find this comprehensive guide particularly useful now that survey research has assumed a primary place in both public and academic circles.
The future of smart cities has arrived, courtesy of citizens and their phones. To prove it, Daniel T. O’Brien explains the transformative insights gleaned from years researching Boston’s 311 reporting system, a sophisticated city management tool that has revolutionized how ordinary Bostonians use and maintain public spaces. Through its phone service, mobile app, website, and Twitter account, 311 catalogues complaints about potholes, broken street lights, graffiti, litter, vandalism, and other issues that are no one citizen’s responsibility but affect everyone’s quality of life. The Urban Commons offers a pioneering model of what modern digital data and technology can do for cities like Boston that seek both prosperous growth and sustainability.
Analyzing a rich trove of data, O’Brien discovers why certain neighborhoods embrace the idea of custodianship and willingly invest their time to monitor the city’s common environments and infrastructure. On the government’s side of the equation, he identifies best practices for implementing civic technologies that engage citizens, for deploying public services in collaborative ways, and for utilizing the data generated by these efforts.
Boston’s 311 system has narrowed the gap between residents and their communities, and between constituents and local leaders. The result, O’Brien shows, has been the creation of more effective policy and practices that reinvigorate the way citizens and city governments approach their mutual interests. By unpacking when, why, and how the 311 system has worked for Boston, The Urban Commons reveals the power and potential of this innovative system, and the lessons learned that other cities can adapt.
Utah’s leading social scientists and population-related scholars draw on their specific areas of expertise and analyze Utah’s population using recent sources of data such as the 2000 U.S. Census. The chapters are organized into three broad topical sections: the foundations of Utah’s population (basic demographics), how the nature of the population affects our daily lives (quality of life issues), and the public policy challenges that will face Utah’s leaders (emerging issues).
Will America find enough good teachers to staff its public schools? How can we ensure that all our children will be taught by skilled professionals? The policies that determine who teaches today are a confusing and often conflicting array that includes tougher licensing requirements, higher salaries, mandatory master's degrees, merit pay, and alternative routes to certification. Who Will Teach? examines these policies and separates those that work from those that backfire.
The authors present an intriguing portrait of America's teachers and reveal who they are, who they have been, and who they will be. Using innovative statistical methods to track the professional lives of more than 50,000 college graduates, the book describes, in many cases for the first time, just how prospective, current, and former teachers respond to the incentives and disincentives they face. The authors, a group of noted educators, economists, and statisticians, find cause for serious concern. Few academically talented college graduates even try teaching, and many of those who do leave quickly, never to return. Current licensing requirements stifle innovation in training and dissuade many potentially talented teachers at the outset.
But Who Will Teach? shows that we can reverse these trends if we get the incentives right. Although better salaries are essential, especially for new teachers, money is not enough. Potential teachers should be offered alternative paths into the classroom. School districts should improve their recruiting strategies. Licensing criteria should assess teaching skills, not just academic achievement and number of courses completed. The authors offer a promising strategy based on high standards and substantial rewards.
World Inequality Report 2018 is the most authoritative and up-to-date account of global trends in inequality. Researched, compiled, and written by a team of the world’s leading economists of inequality, it presents—with unrivaled clarity and depth—information and analysis that will be vital to policy makers and scholars everywhere.
Inequality has taken center stage in public debate as the wealthiest people in most parts of the world have seen their share of the economy soar relative to that of others, many of whom, especially in the West, have experienced stagnation. The resulting political and social pressures have posed harsh new challenges for governments and created a pressing demand for reliable data. The World Inequality Lab at the Paris School of Economics and the University of California, Berkeley, has answered this call by coordinating research into the latest trends in the accumulation and distribution of income and wealth on every continent. This inaugural report analyzes the Lab’s findings, which include data from major countries where information has traditionally been difficult to acquire, such as China, India, and Brazil. Among nations, inequality has been decreasing as traditionally poor countries’ economies have caught up with the West. The report shows, however, that inequality has been steadily deepening within almost every nation, though national trajectories vary, suggesting the importance of institutional and policy frameworks in shaping inequality.
World Inequality Report 2018 will be a key document for anyone concerned about one of the most imperative and contentious subjects in contemporary politics and economics.
Produced by a team of world-leading economists, this is the benchmark account of recent and historical trends in inequality.
World Inequality Report 2022 is the most authoritative and comprehensive account available of global trends in inequality. Researched, compiled, and written by a team of world-leading economists, the report builds on the pioneering edition of 2018 to provide policy makers and scholars everywhere up-to-date information about an ever broader range of countries and about forms of inequality that researchers have previously ignored or found hard to trace.
Over the past decade, inequality has taken center stage in public debate as the wealthiest people in most parts of the world have seen their share of the economy soar relative to that of others. The resulting political and social pressures have posed harsh new challenges for governments and created a pressing demand for reliable data. The World Inequality Lab, housed at the Paris School of Economics and the University of California, Berkeley, has answered this call by coordinating research into the latest trends in the accumulation and distribution of income and wealth on every continent. This new report not only extends the lab’s international reach but provides crucial new information about the history of inequality, gender inequality, environmental inequalities, and trends in international tax reform and redistribution.
World Inequality Report 2022 will be a key document for anyone concerned about one of the most imperative and contentious subjects in contemporary politics and economics.
All the life tables, standardized rates, and projections have been generated by uniform methods to ensure easy comparison among countries. More than 800 charts provide a foundation for analyzing the radical demographic changes now taking place: the historic lows of fertility in Germany and other industrial countries, Africa's persistently high fertility, and the worldwide extension of life expectancy. The product of cautious and painstaking labor, this work promises to be an important resource for further demographic research as well as a valuable comparative resource for studies of the status of global social welfare and the environment.
READERS
Browse our collection.
PUBLISHERS
See BiblioVault's publisher services.
STUDENT SERVICES
Files for college accessibility offices.
RECENTLY PUBLISHED


UChicago Accessibility Resources
home | accessibility | search | about | contact us
BiblioVault ® 2001 - 2024
The University of Chicago Press