Shadow Exchanges along the New Silk Roads
Amsterdam University Press, 2020
eISBN: 978-90-485-4134-8
See other books on: Development | Economic Development | Exports & Imports | International Relations | Trade & Tariffs
See other titles from Amsterdam University Press
eISBN: 978-90-485-4134-8
ABOUT THIS BOOK | TOC
ABOUT THIS BOOK
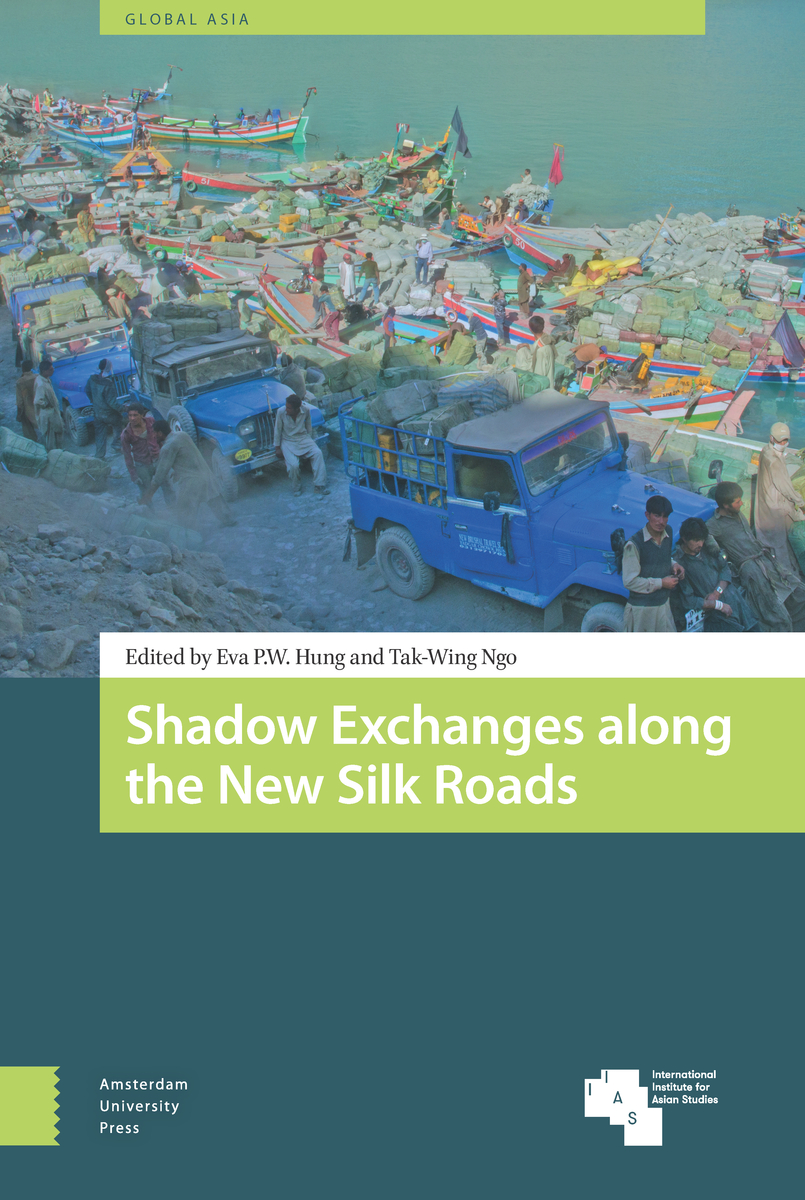
Long before China promulgated the official One Belt One Road initiatives, vast networks of cross-border exchanges already existed across Asia and Eurasia. The dynamics of such trade and resource flows have largely been outside state control, and are pushed to the realm of the shadow economy. The official initiative is a state-driven attempt to enhance the orderly flow of resources across countries along the Belt and Road, hence extending the reach of the states to the shadow economies. This volume offers a bottom-up view of the transborder informal exchanges across Asia and Eurasia, and analyses its clash and mesh with the state-orchestrated Belt and Road cooperation. By undertaking a comparative study of country cases along the new silk roads, the book underlines the intended and unintended consequences of such competing routes of connectivity on the socio-economic conditions of local communities.
See other books on: Development | Economic Development | Exports & Imports | International Relations | Trade & Tariffs
See other titles from Amsterdam University Press


