
 A SCHOLARLY BOOK REPOSITORY
25 start with M start with M
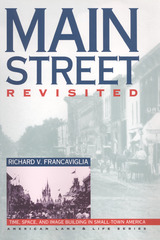
As an archetype for an entire class of places, Main Street has become one of America's most popular and idealized images. In Main Street Revisited, the first book to place the design of small downtowns in spatial and chronological context, Richard Francaviglia finds the sources of romanticized images of this archetype, including Walt Disney's Main Street USA, in towns as diverse as Marceline, Missouri, and Fort Collins, Colorado.
Francaviglia interprets Main Street both as a real place and as an expression of collective assumptions, designs, and myths; his Main Streets are treasure troves of historic patterns. Using many historical and contemporary photographs and maps for his extensive fieldwork and research, he reveals a rich regional pattern of small-town development that serves as the basis for American community design. He underscores the significance of time in the development of Main Street's distinctive personality, focuses on the importance of space in the creation of place, and concentrates on popular images that have enshrined Main Street in the collective American consciousness.
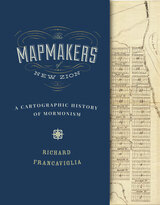
From their earliest days on the American frontier through their growth into a worldwide church, the spatially expansive Mormons made maps to help them create idealized communities, migrate to and colonize large parts of the American West, visualize the stories in their sacred texts, and spread their message internationally through a well-organized missionary system. This book identifies many Mormon mapmakers who played an important but heretofore unsung role in charting the course of Latter-day Saint history. For Mormons, maps had and continue to have both practical and spiritual significance. In addition to using maps to help build their new Zion and to explore the Intermountain West, Latter-day Saint mapmakers used them to depict locations and events described in the Book of Mormon.
Featuring over one hundred historical maps reproduced in full color—many never before published—The Mapmakers of New Zion sheds new light on Mormonism and takes readers on a fascinating journey through maps as both historical documents and touchstones of faith.
Winner of the Southwest Book Design and Production Award from the New Mexico Book Association.
Selected as one of the American Library Association's Best of the Best from University Presses.
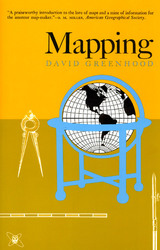
"This book should be welcomed by all students of mapping, for it will take them in uncomplicated stages through the complexities of compiling a map. . . . Mr. Greenwood is to be congratulated on an excellent book."—C.J. Angus, Canadian Geographical Journal
"For the baggy and middle-aged who cannot afford skiing in Austria or sailing off Bimini, Greenhood invites his readers to a sort of intellectual excitement which neither skiing nor sailing could equal. . . . Unless you work professionally with maps to the degree that a navigator does, for instance, this book will fascinate and enthrall you."—Monroe Bush, American Forests
"A teacher who wishes to go into the classroom with a storehouse of knowledge and ideas will find this a remarkable book. It is easy to read, and each page contains information which can be fed into the work in progress no matter which area of the world is being studied."—Instructor
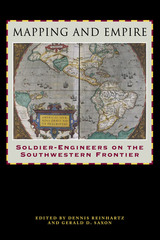
From the sixteenth through the mid-nineteenth centuries, Spain, then Mexico, and finally the United States took ownership of the land from the Gulf Coast of Texas and Mexico to the Pacific Coast of Alta and Baja California—today's American Southwest. Each country faced the challenge of holding on to territory that was poorly known and sparsely settled, and each responded by sending out military mapping expeditions to set boundaries and chart topographical features. All three countries recognized that turning terra incognita into clearly delineated political units was a key step in empire building, as vital to their national interest as the activities of the missionaries, civilian officials, settlers, and adventurers who followed in the footsteps of the soldier-engineers.
With essays by eight leading historians, this book offers the most current and comprehensive overview of the processes by which Spanish, Mexican, and U.S. soldier-engineers mapped the southwestern frontier, as well as the local and even geopolitical consequences of their mapping. Three essays focus on Spanish efforts to map the Gulf and Pacific Coasts, to chart the inland Southwest, and to define and defend its boundaries against English, French, Russian, and American incursions. Subsequent essays investigate the role that mapping played both in Mexico's attempts to maintain control of its northern territory and in the United States' push to expand its political boundary to the Pacific Ocean. The concluding essay draws connections between mapping in the Southwest and the geopolitical history of the Americas and Europe.
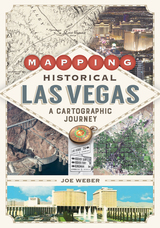
Reaching past the city limits, Mapping Historical Las Vegas also examines the development of public lands, military bases, and the canyons and valleys of the Colorado River before the Hoover Dam was built and Lake Mead was created. Weber also includes information on dams, highways, railroads, and other projects that were planned but never constructed— showing what might have been in one of the nation’s largest cities.
With 137 color maps generated using Geographic Information Systems, along with extensive mapping by Weber that draws on his decades of experience in the region, Mapping Historical Las Vegas offers a unique perspective on one of the world’s most famous desert cities.
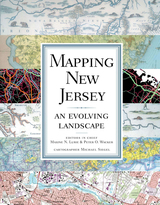
Tracing the changes in environment, land use patterns, demography, transportation, economy, and politics over the course of many centuries, Mapping New Jerseyilluminates the state's transformation from a simple agricultural society to a post-industrial and culturally diverse place inhabited by more people per acre than anywhere else in the country.
An innovator in transportation, from railroads to traffic circles to aviation, New Jersey from its beginnings was a "corridor" state, with a dense Native American trail system once crisscrossed on foot, country roads traveled by armies of the American Revolution, and, lately, the rolling wheels of many sedans, SUVs, hybrids, public and commercial vehicles, and freight. Early to industrialize, it also served as the headquarters for Thomas Edison and the development of the modern American economy. Small in territory and crowded with people, the state works to recycle garbage and, at the same time, best utilize and preserve its land.
New Jersey has been depicted in useful and quite stunning historical maps, many of the best included in Mapping New Jerseyùcrude maps drawn by sixteenth-century navigators; complex and beautifully decorated pieces created by early Dutch cartographers; land maps plotted by seventeenth-century English settlement surveyors; examples of the nineteenth century's scientific revolution in map making that helped locate topography and important mineral resources; detailed insurance maps that correct London map maker William Faden's 1777-78 classic rendering of the state; and aerial photos, remote sensing, and global positioning system maps generated through twenty-first-century technology breakthroughs in cartography.
Integrating new maps, graphs, and diagrams unavailable through ordinary research or Internet searches, Mapping New Jersey is divided into six topical chapters, each accompanied by an introduction and overview telling the story of the state's past and detailing its diversity. Mapping New Jersey, dramatically bold and in full color, travels where New Jersey has gone and the rest of the nation is likely to follow.
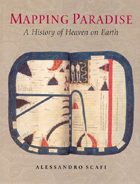
Mapping Paradise is a history of the cartography of paradise that journeys from the beginning of Christianity to the present day. Instead of dismissing the medieval belief in a paradise on earth as a picturesque legend and the cartography of paradise as an example of the period’s many superstitions, Alessandro Scafi explores the intellectual conditions that made the medieval mapping of paradise possible. The challenge for mapmakers, Scafi argues, was to make visible a place that was geographically inaccessible and yet real, remote in time and yet still the scene of an essential episode of the history of salvation. Mapping Paradise also accounts for the transformations, in both theological doctrine and cartographical practice, that brought about the decline of the belief in a terrestrial paradise and the emergence of the new historical and regional mapping of the Garden of Eden that began at the time of the Reformation and still continues today.
The first book to show how paradise has been expressed in cartographic form throughout two millennia, Mapping Paradise reveals how the most deeply reflective thoughts about the ultimate destiny of all human life have been molded and remolded, generation by generation.
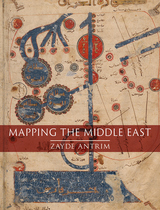
Organized chronologically, Mapping the Middle East addresses the medieval “Realm of Islam;” the sixteenth- to eighteenth-century Ottoman Empire; French and British colonialism through World War I; nationalism in modern Turkey, Iran, and Israel/Palestine; and alternative geographies in the twentieth and twenty-first centuries. Vivid color illustrations throughout allow readers to compare the maps themselves with Antrim’s analysis. Much more than a conventional history of cartography, Mapping the Middle East is an incisive critique of the changing relationship between maps and belonging in a dynamic world region over the past thousand years.
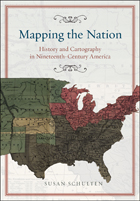
In the nineteenth century, Americans began to use maps in radically new ways. For the first time, medical men mapped diseases to understand and prevent epidemics, natural scientists mapped climate and rainfall to uncover weather patterns, educators mapped the past to foster national loyalty among students, and Northerners mapped slavery to assess the power of the South. After the Civil War, federal agencies embraced statistical and thematic mapping in order to profile the ethnic, racial, economic, moral, and physical attributes of a reunified nation. By the end of the century, Congress had authorized a national archive of maps, an explicit recognition that old maps were not relics to be discarded but unique records of the nation’s past.
All of these experiments involved the realization that maps were not just illustrations of data, but visual tools that were uniquely equipped to convey complex ideas and information. In Mapping the Nation, Susan Schulten charts how maps of epidemic disease, slavery, census statistics, the environment, and the past demonstrated the analytical potential of cartography, and in the process transformed the very meaning of a map.
Today, statistical and thematic maps are so ubiquitous that we take for granted that data will be arranged cartographically. Whether for urban planning, public health, marketing, or political strategy, maps have become everyday tools of social organization, governance, and economics. The world we inhabit—saturated with maps and graphic information—grew out of this sea change in spatial thought and representation in the nineteenth century, when Americans learned to see themselves and their nation in new dimensions.

Mapping Wonderlands fills part of this gap in existing regional studies by looking at early popular pictorial maps of Arizona. These cartographic representations of the state utilize formal mapmaking conventions to create a place-based state history. They introduce illustrations, unique naming conventions, and written narratives to create carefully visualized landscapes that emphasize the touristic aspects of Arizona.
Analyzing the visual culture of tourism in illuminating detail, this book documents how Arizona came to be identified as an appealing tourism destination. Providing a historically situated analysis, Dori Griffin draws on samples from a comprehensive collection of materials generated to promote tourism during Arizona’s first half-century of statehood. She investigates the relationship between natural and constructed landscapes, visual culture, and narratives of place. Featuring sixty-six examples of these aesthetically appealing maps, the book details how such maps offered tourists and other users a cohesive and storied image of the state. Using historical documentation and rhetorical analysis, this book combines visual design and historical narrative to reveal how early-twentieth-century mapmakers and map users collaborated to imagine Arizona as a tourist’s paradise.
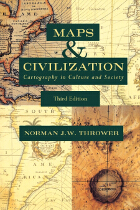
The third edition of Maps and Civilization incorporates numerous revisions, features new material throughout the book, and includes a new alphabetized bibliography.
Praise for previous editions of Maps and Civilization:
“A marvelous compendium of map lore. Anyone truly interested in the development of cartography will want to have his or her own copy to annotate, underline, and index for handy referencing.”—L. M. Sebert, Geomatica
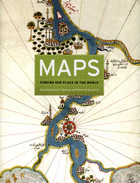
The book begins by examining the use of maps for wayfinding, revealing that even maps as common and widely used as these are the product of historical circumstances and cultural differences. The second chapter considers maps whose makers employed the smallest of scales to envision the broadest of human stages—the world, the heavens, even the act of creation itself. The next chapter looks at maps that are, literally, at the opposite end of the scale from cosmological and world maps—maps that represent specific parts of the world and provide a close-up view of areas in which their makers lived, worked, and moved.
Having shown how maps help us get around and make sense of our greater and lesser worlds, Maps then turns to the ways in which certain maps can be linked to particular events in history, exploring how they have helped Americans, for instance, to understand their past, cope with current events, and plan their national future. The fifth chapter considers maps that represent data from scientific instruments, population censuses, and historical records. These maps illustrate, for example, how diseases spread, what the ocean floor looks like, and how the weather is tracked and predicted. Next comes a turn to the imaginary, featuring maps that depict entire fictional worlds, from Hell to Utopia and from Middle Earth to the fantasy game World of Warcraft. The final chapter traces the origins of map consumption throughout history and ponders the impact of cartography on modern society.
A companion volume to the most ambitious exhibition on the history of maps ever mounted in North America, Maps will challenge readers to stretch conventional thought about what constitutes a map and how many different ways we can understand graphically the environment in which we live. Collectors, historians, mapmakers and users, and anyone who has ever “gotten lost” in the lines and symbols of a map will find much to love and learn from in this book.
In Maps in Tudor England, P. D. A. Harvey traces this revolution of production, understanding, and use of maps in England from 1485 to 1603. By the mid-sixteenth century, mapmapers had begun to draw maps to a consistent scale, reproducing the results of measured survey. By the end of the century, maps drawn to scale and showing features by conventional signs were commonly used throughout England.
In this survey Harvey focuses on maps of small areas, up to the size of a county, exploring their impact on the political and social life of England in the spheres of the military, government, towns, landed estates, buildings, and the law. Richly illustrated with thirty color and fifty black and white reproductions of rare maps, his account is an informative and accessible introduction to this revolutionary period in the history of cartography, as well as a unique visual history of Tudor England.
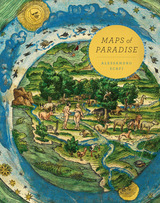
Maps of Paradise charts the diverse ways in which scholars and mapmakers from the eighth to the twenty-first century rose to the challenge of identifying the location of paradise on a map, despite the certain knowledge that it was beyond human reach. Over one hundred illustrations celebrate this history of a paradox: the mapping of the unmappable. It is also a mirror to the universal dream of perfection and happiness, and the yearning to discover heaven on earth.
"A most welcome and thorough investigation of a neglected aspect of both the history of cartography and modern cartographic practice."—Mapline
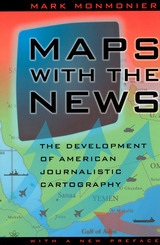
"A well-written, scholarly treatment of journalistic cartography. . . . It is well researched, thoroughly indexed and referenced . . . amply illustrated."—Judith A. Tyner, Imago Mundi
"There is little doubt that Maps with the News should be part of the training and on the desks of all those concerned with producing maps for mass consumption, and also on the bookshelves of all journalists, graphic artists, historians of cartography, and geographic educators."—W. G. V. Balchin, Geographical Journal
"A definitive work on journalistic cartography."—Virginia Chipperfield, Society of University Cartographers Bulletin
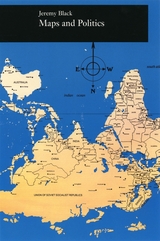
consolidate their power realized that better knowledge of
their lands would strengthen their control over them. By
1550, the cartographer's art had already become an important
instrument for bringing territories under the control of
centralized government; increasing governmental reliance on
maps stimulated the refinement of cartographic techniques
throughout the following century.
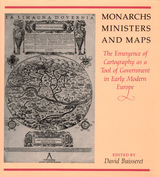
This volume, a detailed survey of the political uses of
cartography between 1400 and 1700 in Italy, France, England,
Poland, Austria, and Spain, answers these questions: When
did monarchs and ministers begin to perceive that maps could
be useful in government? For what purposes were maps
commissioned? How accurate and useful were they? How did
cartographic knowledge strengthen the hand of government?
The chapters offer new insights into the development of
cartography and its role in European history.
Contributors to the volume are John Marino, Peter
Barber, David Buisseret, Geoffrey Parker, James Vann, and
Michael J. Mikòs.
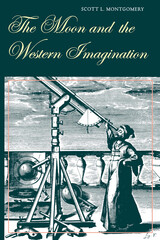
Scott Montgomery has produced a richly detailed analysis of how the Moon has been visualized in Western culture through the ages, revealing the faces it has presented to philosophers, writers, artists, and scientists for nearly three millennia. To do this, he has drawn on a wide array of sources that illustrate mankind's changing concept of the nature and significance of heavenly bodies from classical antiquity to the dawn of modern science.
Montgomery especially focuses on the seventeenth century, when the Moon was first mapped and its features named. From literary explorations such as Francis Godwin's Man in the Moone and Cyrano de Bergerac's L'autre monde to Michael Van Langren's textual lunar map and Giambattista Riccioli's Almagestum novum, he shows how Renaissance man was moved by the lunar orb, how he battled to claim its surface, and how he in turn elevated the Moon to a new level in human awareness. The effect on human imagination has been cumulative: our idea of the Moon, and therefore the planets, is multilayered and complex, having been enriched by associations played out in increasingly complicated harmonies over time. We have shifted the way we think about the lunar face from a "perfect" body to an earthlike one, with corresponding changes in verbal and visual expression.
Ultimately, Montgomery suggests, our concept of the Moon has never wandered too far from the world we know best—the Earth itself. And when we finally establish lunar bases and take up some form of residence on the Moon's surface, we will not be conquering a New World, fresh and mostly unknown, but a much older one, ripe with history.
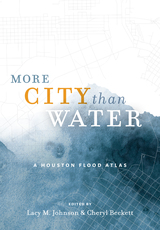
2022 Art in Service to the Environment Award, Sierra Club Lone Star Chapter
Honorable Mention, 2022 Nonfiction Prize, Writers' League of Texas
Writers explore a city’s relationship with chronic catastrophic flooding.
Shortly after Hurricane Harvey dumped a record 61 inches of rain on Houston in 2017, celebrated writer and Bayou City resident Lacy M. Johnson began collecting flood stories. Although these stories attested to the infinite variety of experience in America’s most diverse city, they also pointed to a consistent question: What does catastrophic flooding reveal about this city, and what does it obscure?
More City than Water brings together essays, conversations, and personal narratives from climate scientists, marine ecologists, housing activists, urban planners, artists, poets, and historians as they reflect on the human geography of a region increasingly defined by flooding. Both a literary and a cartographic anthology, More City than Water features striking maps of Houston’s floodplains, waterways, drainage systems, reservoirs, and inundated neighborhoods. Designed by University of Houston seniors from the Graphic Design program, each map, imaginative and precise, shifts our understanding of the flooding, the public’s relationship to it, and the fraught reality of rebuilding. Evocative and unique, this is an atlas that uncovers the changing nature of living where the waters rise.
READERS
Browse our collection.
PUBLISHERS
See BiblioVault's publisher services.
STUDENT SERVICES
Files for college accessibility offices.
RECENTLY PUBLISHED


")
")


UChicago Accessibility Resources
home | accessibility | search | about | contact us
BiblioVault ® 2001 - 2024
The University of Chicago Press