
 A SCHOLARLY BOOK REPOSITORY
In our current screen-saturated culture, we take in more information through visual means than at any point in history. The computers and smart phones that constantly flood us with images do more than simply convey information. They structure our relationship to information through graphical formats. Learning to interpret how visual forms not only present but produce knowledge, says Johanna Drucker, has become an essential contemporary skill.
Graphesis provides a descriptive critical language for the analysis of graphical knowledge. In an interdisciplinary study fusing digital humanities with media studies and graphic design history, Drucker outlines the principles by which visual formats organize meaningful content. Among the most significant of these formats is the graphical user interface (GUI)—the dominant feature of the screens of nearly all consumer electronic devices. Because so much of our personal and professional lives is mediated through visual interfaces, it is important to start thinking critically about how they shape knowledge, our behavior, and even our identity.
Information graphics bear tell-tale signs of the disciplines in which they originated: statistics, business, and the empirical sciences. Drucker makes the case for studying visuality from a humanistic perspective, exploring how graphic languages can serve fields where qualitative judgments take priority over quantitative statements of fact. Graphesis offers a new epistemology of the ways we process information, embracing the full potential of visual forms and formats of knowledge production.
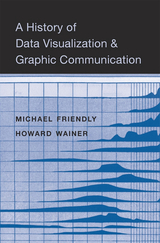
A comprehensive history of data visualization—its origins, rise, and effects on the ways we think about and solve problems.
With complex information everywhere, graphics have become indispensable to our daily lives. Navigation apps show real-time, interactive traffic data. A color-coded map of exit polls details election balloting down to the county level. Charts communicate stock market trends, government spending, and the dangers of epidemics. A History of Data Visualization and Graphic Communication tells the story of how graphics left the exclusive confines of scientific research and became ubiquitous. As data visualization spread, it changed the way we think.
Michael Friendly and Howard Wainer take us back to the beginnings of graphic communication in the mid-seventeenth century, when the Dutch cartographer Michael Florent van Langren created the first chart of statistical data, which showed estimates of the distance from Rome to Toledo. By 1786 William Playfair had invented the line graph and bar chart to explain trade imports and exports. In the nineteenth century, the “golden age” of data display, graphics found new uses in tracking disease outbreaks and understanding social issues. Friendly and Wainer make the case that the explosion in graphical communication both reinforced and was advanced by a cognitive revolution: visual thinking. Across disciplines, people realized that information could be conveyed more effectively by visual displays than by words or tables of numbers.
Through stories and illustrations, A History of Data Visualization and Graphic Communication details the 400-year evolution of an intellectual framework that has become essential to both science and society at large.
READERS
Browse our collection.
PUBLISHERS
See BiblioVault's publisher services.
STUDENT SERVICES
Files for college accessibility offices.
RECENTLY PUBLISHED


UChicago Accessibility Resources
home | accessibility | search | about | contact us
BiblioVault ® 2001 - 2024
The University of Chicago Press